Overview of Loomis
Ask a dozen Loomis residents what keeps them here, and you’ll hear the same refrain: the town is like a big family.
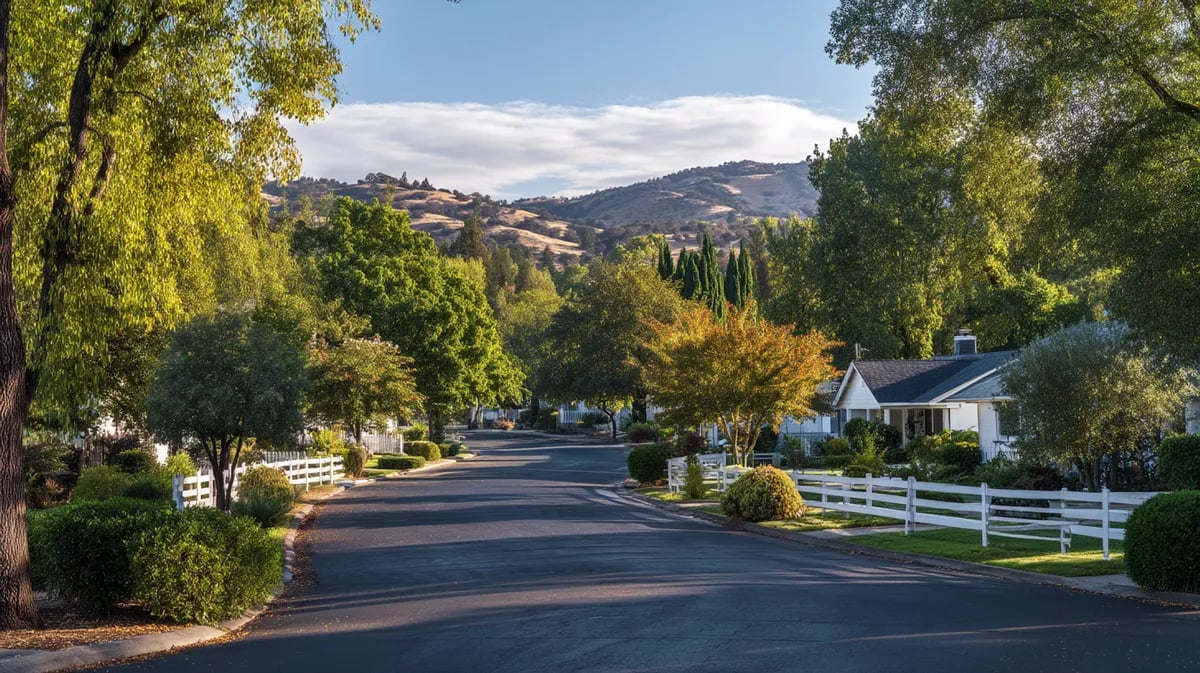
Tucked into the northeastern corner of Placer County, this small town living experience still feels authentic, think Friday‑night football at Del Oro High School, neighbors waving from golf carts, and streets where brothers loved Loomis enough to stick around after graduation.
For buyers hunting for that great small-town vibe without straying too far from Sacramento’s job market, Loomis ticks a lot of boxes.
Geographical Location
Loomis sits along I‑80 between Roseville and Auburn, about twenty‑five miles from downtown Sacramento. The Sierra Nevada foothills roll just to the east, and Folsom Lake’s north shore is a quick ten‑minute drive.
This location gives Loomis, California, quick access to mountain snow in winter and lake days in summer - one more reason reviews from newcomers often read “whether they live here already or are just scouting homes for sale in Loomis, the outdoor access is hard to beat.”
Cost of Living in Loomis
Housing drives the budget conversation.
Zillow’s Home Value Index puts the typical Loomis property near $938,000, while Realtor’s June 2025 snapshot for ZIP 95650 shows a median list price around $1.3 million, up 8.7 percent year over year. Average rent sits at roughly $2,070 a month, so many newcomers decide it’s smarter to buy sooner rather than later.
Overall expenses run about 33 percent above the U.S. norm, according to PayScale.
California’s effective property‑tax rate of roughly 0.71 percent keeps annual bills for a median‑priced Loomis home near $6,600, a softer hit than in many states with comparable prices.
Layer in a median household income just over $103,000, and most locals figure the premium buys them generous lot sizes, strong schools, and that foothill lifestyle visitors envy.
Loomis, CA Crime Breakdown
Historical FBI crime data show Loomis crime has held fairly steady over the past decade, mirroring the broader dip in U.S. violent crime since the 1990s.
The rate of property crime in Loomis fluctuates year‑to‑year, but the overall trend is flat to slightly downward, while the violent crime rate edges lower, a pattern locals like to point to when they say Loomis is still one of the safest areas in Placer County.
Property Crime
Property crime in Loomis runs roughly 13.8 incidents per 1,000 residents each year, with theft and burglary leading the list.
NeighborhoodScout pegs the narrower FBI crime data‑based property crime rate at about 7.23 per 1,000, translating to a one‑in‑138 chance of being a victim of property crime in Loomis.
That figure is less than half the national average property crime rate of 19.5 per 1,000, underscoring why many locals describe crime in Loomis as low for a town its size.
Violent Crime
Violent crime sits even lower.
CrimeGrade calculates just 3.21 violent incidents per 1,000 residents, while NeighborhoodScout’s FBI crime statistics list a 3.39 rate and a one‑in‑295 chance of being a victim of violent crime in Loomis, meaning Loomis is safer than about sixty percent of U.S. cities on this metric.
Compare that to the national average of 3.8 per 1,000, and Loomis crime rates look reassuringly modest.
Other Crime
“Other” offenses, everything from vandalism to drug crimes, add another 3.66 incidents per 1,000 residents in the typical year.
Charts below are detailed crime breakdowns on CrimeGrade, but the takeaway is simple: the violent crime rate plus property crime rate in Loomis still lands beneath the national average.
Comparing Crime Rates: Loomis vs. Nearby Cities
Loomis stacks up well when you look at safety across the region. Its crime rates come in lower than California averages and below most nearby cities, which adds to its appeal for people who want small-town living without giving up peace of mind.
Comparison of Loomis Crime Rates with California
California state averages run 5.08 violent crimes and roughly 24 property crimes per 1,000 residents. Put next to those numbers, the rate of crime in Loomis is lower than the state on both counts, reinforcing the town’s reputation as safer than the average CA crime snapshot.
Crime Rate Comparison with Nearby Neighborhoods
Rocklin posts about 21.4 total crimes per 1,000, Lincoln comes in at 17.9, and Roseville’s property crime alone runs 15 per 1,000.
Loomis crime map highlights the safest areas in Loomis in green, and even in spots where crime is slightly higher, the numbers rarely spike above what similarly sized city with FBI crime data might show.
If you compare Loomis to the closest similar-sized city with FBI reports, you’ll see Loomis ranks better than seventy percent of California locales in overall safety.
Safety Measures and Resources
From neighborhood watch groups to the S.T.A.R.S. vacation‑check service, safety in Loomis feels hands‑on.
The sheriff’s youth and community services sergeant runs “Coffee with a Cop” meet‑ups, and parents praise campus officers who treat students “like Loomis is still small enough that the town is like a big backyard.”
Chance of Being a Victim of Crime in Loomis
CrimeGrade’s analysts estimate a one‑in‑92 chance of being a victim of any crime in the south end of town and a one‑in‑28 chance on the busier north side.
Those odds shrink further when you factor in that many incidents counted on the map involve visitors rather than Loomis residents in a standard year.
Role of the Loomis Police Department
The Town of Loomis contracts with the Placer County Sheriff’s South Placer Substation on Horseshoe Bar Road, staffed by six patrol sergeants, thirty‑four deputies, plus school resource officers and the volunteer S.T.A.R.S. program in Placer County.
Their community‑policing model means patrol cars are a common sight near Del Oro High School events and downtown gatherings—visibility that residents say helps keep crime in Loomis lower.
Living in Loomis: Is it a Safe Place to Live?
Interpreting the Loomis maps and statistics, most newcomers quickly see why the town’s grade indicates that the rate of property crime and violent incidents sits below the national average.
Crime in Loomis varies by neighborhood. Areas in Loomis in green on the crime map show the least crime, while the west side near retail shows higher crime counts because that zone sees the most incidents from shoppers passing through.
For families eyeing small town living within commuting distance of Sacramento, Loomis is safer than the average US city and compares favorably against almost every similarly sized city with FBI crime statistics.
Conclusion and Recommendations
By weaving together FBI crime statistics, CrimeGrade maps and statistics, and county data, it’s clear that Loomis ranks among the safest places in California for a town its size.
Whether you’re raising kids, downsizing, or hunting for the property crime rate in Loomis figures before making an offer, the detailed crime statistics above suggest that living in Loomis offers peace of mind without sacrificing proximity to Sacramento.
Summary of Crime Statistics
The latest FBI crime data show 3.39 violent crimes and 7.23 property crimes per 1,000 Loomis residents.
CrimeGrade’s broader dataset puts total crime at 20.68, with a B‑ safety grade and an annual cost of crime in Loomis of about $850 per household.
Placer County’s county‑wide violent crime rate of 2.84 per 1,000 is already well below the California figure of 5.11, and Loomis trends even lower.
Future Outlook for Crime in Loomis
With population growth holding steady at just under seven thousand and median household income rising, Loomis is still positioned to keep crime rates measured per resident under control.
Community policing, school resource officers, and homeowners investing in smart‑home security all point toward a continued slow decline in both violent and property crime rates in Loomis.
Loomis, California Safety FAQs
What does the Loomis crime map show about the safest areas in Loomis?
The crime map highlights the safest areas in Loomis in green, mostly south of downtown around Sierra College Boulevard. Red patches on the map cluster near retail corridors where visitors, not residents, drive up incident counts.
How does the cost of crime in Loomis compare to the national average?
At roughly $311 per resident each year, the cost of crime in Loomis is about $150 less than the national average, showing Loomis is safer and cheaper on this metric.
Is the violent crime rate in Loomis higher than in nearby Rocklin or Lincoln?
No. Loomis posts 3.21 violent crimes per 1,000, versus Rocklin’s 3.2 and Lincoln’s 2.8, putting all three towns well below the California state average CrimeGrade.
Does Loomis have a higher crime rate than the national average?
Overall crime per capita in Loomis sits below the national averages for both violent and property offenses—3.39 versus 3.8 for violent, and 13.8 versus 19.5 for property, meaning crime in Loomis is lower than what you’d find in an average US city.


